Protection Statistics
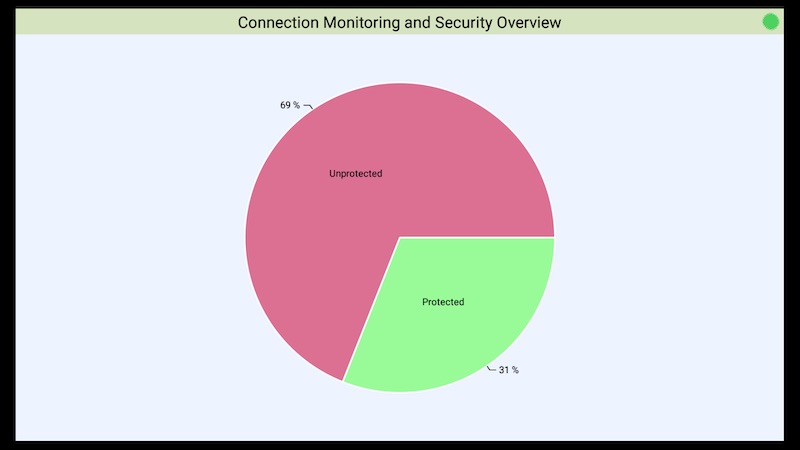
The Protection Statistics feature inside VPNSafetyDot gives you an overview of your protection status. This feature draws a dynamic pie chart based on the total time you are being protected (vpn is running and VPNSafetyDot is green) and the time you are not protected (vpn is not running and VPNSafetyDot is red).
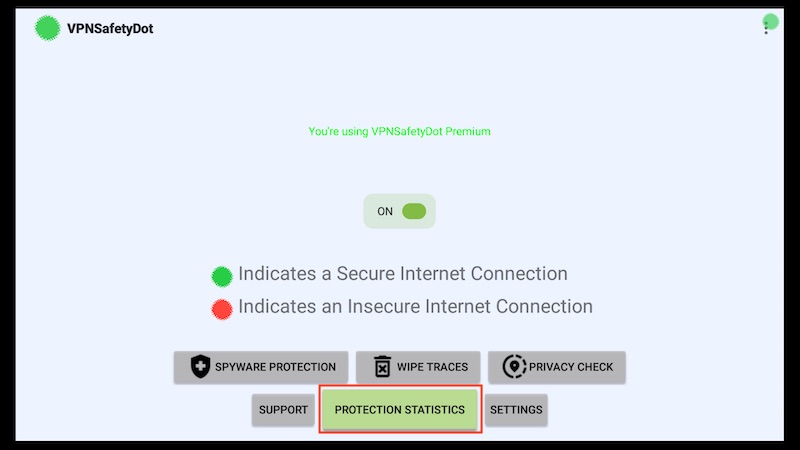
Start the VPNsafetyDot app on your device and choose “Protection Statistics” like shown in the screenshot below. Alternatively you can open the hamburger menu on the upper right corner and choose “Protection Statistics” there.
You will then see a summary as a pie chart. The example below shows that the device was protected for 31% of the time since VPNSafetyDot was running. While creating this screenshots we started VPNSafetyDot for a total time of around 10 minutes. For the first 7 minutes we did not start our vpn. We just connected to our vpn for the last 3 minutes.